Graphs of BlogNomic history
A repository for various bits of graphs and data generated by players over the course of the game.
Contents
Dynasty length
Josh prepared some graphs of BlogNomic's dynasty lengths, in April 2011, making the raw spreadsheet data available here.
Analysis by Josh
Some initial things that stand out: Dynasties have gotten more homogenous since around 40 onwards; dynasties up until 40 seem to average at a month by default, instead tending to come in at either more than 40 days or fewer than 20, with only a few in between:
http://brontides.com/files/dynastychart1.JPG
Meanwhile, 34 days is the most common dynasty length, but the functional window for for dynasty lengths is between 19 and 43 days:
http://brontides.com/files/dynastychart2.JPG
Also, interestingly, July is the least common month for successful DoVs.
Analysis by Winner
Another interesting graph which shows the average dynasty length over the last 5 dynasties.
http://i1117.photobucket.com/albums/k592/Swkoll/bnl5graph.jpg
Proposals and "active" players per month
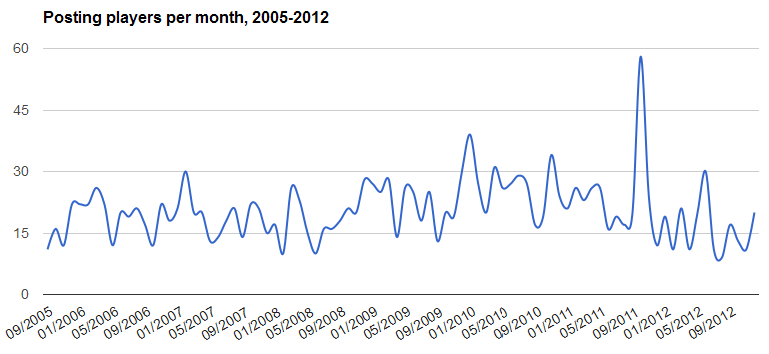
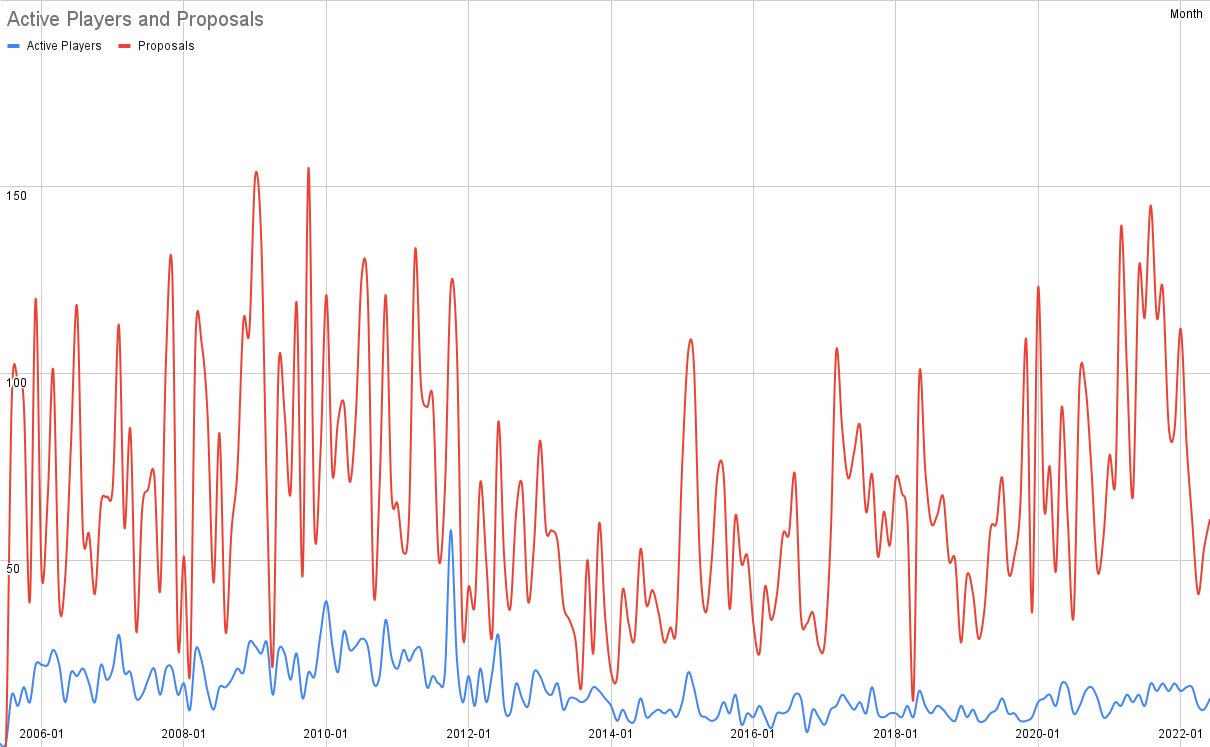
Kevan compiled some data on the number of proposals made each month (grepping for the string ">Proposal: across all monthly archives, which may be imperfect) and the number of "active" players (those who made one post during each month), from 2005 to 2012, and the data is available here.
Proposals per month:
(The number of "active" players per month are shown in red.)
DoV frequency
Kevan's collection of the dates of DoVs (collected here in a clunky spreadsheet that uses 3/2/1 for pass/fail/illegal, and zero for days where nothing happened), between September 2005 and November 2013.


