Difference between revisions of "Graphs of BlogNomic history"
(→Proposals per month: update graph) |
|||
| (14 intermediate revisions by 2 users not shown) | |||
| Line 1: | Line 1: | ||
A repository for various bits of graphs and data generated by players over the course of the game. | A repository for various bits of graphs and data generated by players over the course of the game. | ||
| + | |||
| + | Some further analysis can be found at [[2020 Data Analysis]]. | ||
==Dynasty length== | ==Dynasty length== | ||
| Line 8: | Line 10: | ||
Some initial things that stand out: Dynasties have gotten more homogenous since around 40 onwards; dynasties up until 40 seem to average at a month by default, instead tending to come in at either more than 40 days or fewer than 20, with only a few in between: | Some initial things that stand out: Dynasties have gotten more homogenous since around 40 onwards; dynasties up until 40 seem to average at a month by default, instead tending to come in at either more than 40 days or fewer than 20, with only a few in between: | ||
| − | http://brontides.com/files/dynastychart1.JPG | + | <strike>http://brontides.com/files/dynastychart1.JPG</strike> [dead link] |
Meanwhile, 34 days is the most common dynasty length, but the functional window for for dynasty lengths is between 19 and 43 days: | Meanwhile, 34 days is the most common dynasty length, but the functional window for for dynasty lengths is between 19 and 43 days: | ||
| − | http://brontides.com/files/dynastychart2.JPG | + | <strike>http://brontides.com/files/dynastychart2.JPG</strike> [dead link] |
Also, interestingly, July is the least common month for successful DoVs. | Also, interestingly, July is the least common month for successful DoVs. | ||
| Line 20: | Line 22: | ||
Another interesting graph which shows the average dynasty length over the last 5 dynasties. | Another interesting graph which shows the average dynasty length over the last 5 dynasties. | ||
| − | [[File:bnl5graph.jpg]] | + | [[File:bnl5graph.jpg|center]] |
| + | |||
| + | ===Analysis by Kevan=== | ||
| + | |||
| + | A graph of dynastic durations (from the first 231 dynasties) looks like this: | ||
| + | |||
| + | [[File:Dynastic durations (1-231).png|center|600px]] | ||
| + | |||
| + | From [https://github.com/kevandotorg/blognomic-player-count/blob/main/dynasty%20lengths.csv that data] (measuring only the end dates of each dynasty, so any gaps between dynasties are rolled into the following one), the mean length of a dynasty is 34.89 days and the median is 34. | ||
| + | |||
| + | Broad trends over time: | ||
| + | |||
| + | {| class="wikitable" | ||
| + | ! Dynasties !! Median !! Mean | ||
| + | |- | ||
| + | | 1-50 || 35 || 35.4 | ||
| + | |- | ||
| + | | 51-100 || 34 || 33.5 | ||
| + | |- | ||
| + | | 101-150 || 37 || 38.2 | ||
| + | |- | ||
| + | | 151-200 || 29 || 33.1 | ||
| + | |- | ||
| + | | 200-231 || 32.5 || 33.7 | ||
| + | |} | ||
| + | |||
| + | ==Active players== | ||
| + | |||
| + | ===Analysis by Kevan=== | ||
| + | |||
| + | This was compiled by searching each archive page for posts made by players. A player is considered "active" if they made at least one post to the blog during a given month. The pale blue line tracks new players each month (players who had not been active in any previous months). | ||
| + | |||
| + | [[File:Blognomic player count 2005-2020.png|center|900px]] | ||
| + | |||
| + | Data is only tracked from June 2005, the launch of the ExpressionEngine blog. Generation script and output data are available at https://github.com/kevandotorg/blognomic-player-count | ||
| + | |||
| + | ===Analysis by Ienpw III=== | ||
| + | |||
| + | From a [http://blognomic.com/archive/meta_player_activity blog post]: ''"Out of personal interest I made this chart containing the number of active players per dynasty, and I thought perhaps some of you might be interested."'' - the data is compiled from dynastic histories, which (sometimes) mention the players active at the start and/or ends of dynasties, and Ienpw ''"included everyone who was recorded as being active at some point during a dynasty"''. | ||
| − | + | [[File:Ienpw graph.png|700px|center]] | |
| − | + | Raw data used for this graph is [[Ienpw graph data|here]]. | |
| − | |||
| − | + | ==Proposals per month== | |
| − | '' | + | Kevan compiled some data on the number of proposals made each month (grepping for the string ''">Proposal:'' across all monthly archives, which may be imperfect), from June 2005 to January 2024: |
| − | [[Image:Playerpropgraph.png]] | + | [[Image:Playerpropgraph.png|center|800px]] |
| − | (The number of "active" players per month | + | (The number of "active" players per month, per the earlier section, is shown in blue.) |
==DoV frequency== | ==DoV frequency== | ||
| Line 39: | Line 78: | ||
Kevan's collection of the dates of DoVs (collected [https://docs.google.com/spreadsheet/ccc?key=0AjhtPKjOTCRWdExheFdjOXJVcGRFWnAyVEl3OGRJaHc&usp=sharing here] in a clunky spreadsheet that uses 3/2/1 for pass/fail/illegal, and zero for days where nothing happened), between September 2005 and November 2013. | Kevan's collection of the dates of DoVs (collected [https://docs.google.com/spreadsheet/ccc?key=0AjhtPKjOTCRWdExheFdjOXJVcGRFWnAyVEl3OGRJaHc&usp=sharing here] in a clunky spreadsheet that uses 3/2/1 for pass/fail/illegal, and zero for days where nothing happened), between September 2005 and November 2013. | ||
| − | [[Image:Dov history.png|700px]] | + | [[Image:Dov history.png|700px|center]] |
Latest revision as of 16:09, 15 February 2025
A repository for various bits of graphs and data generated by players over the course of the game.
Some further analysis can be found at 2020 Data Analysis.
Contents
Dynasty length
Josh prepared some graphs of BlogNomic's dynasty lengths, in April 2011, making the raw spreadsheet data available here.
Analysis by Josh
Some initial things that stand out: Dynasties have gotten more homogenous since around 40 onwards; dynasties up until 40 seem to average at a month by default, instead tending to come in at either more than 40 days or fewer than 20, with only a few in between:
http://brontides.com/files/dynastychart1.JPG [dead link]
Meanwhile, 34 days is the most common dynasty length, but the functional window for for dynasty lengths is between 19 and 43 days:
http://brontides.com/files/dynastychart2.JPG [dead link]
Also, interestingly, July is the least common month for successful DoVs.
Analysis by Winner
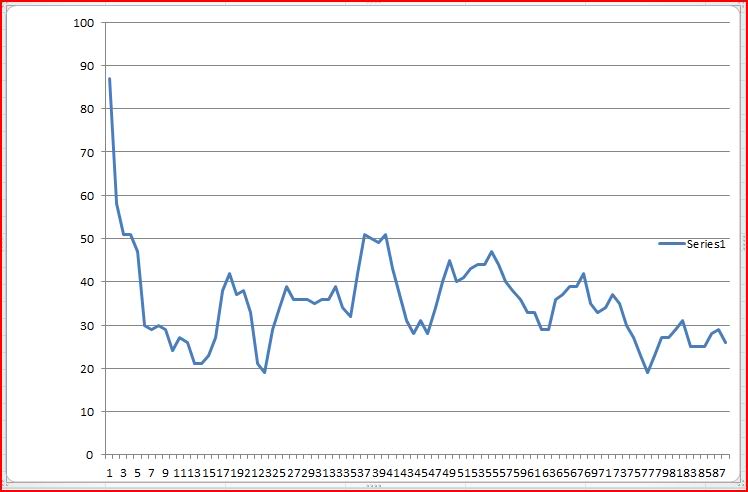
Another interesting graph which shows the average dynasty length over the last 5 dynasties.
Analysis by Kevan
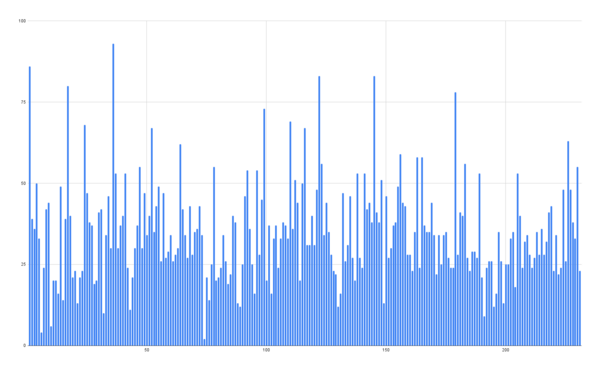
A graph of dynastic durations (from the first 231 dynasties) looks like this:
From that data (measuring only the end dates of each dynasty, so any gaps between dynasties are rolled into the following one), the mean length of a dynasty is 34.89 days and the median is 34.
Broad trends over time:
| Dynasties | Median | Mean |
|---|---|---|
| 1-50 | 35 | 35.4 |
| 51-100 | 34 | 33.5 |
| 101-150 | 37 | 38.2 |
| 151-200 | 29 | 33.1 |
| 200-231 | 32.5 | 33.7 |
Active players
Analysis by Kevan
This was compiled by searching each archive page for posts made by players. A player is considered "active" if they made at least one post to the blog during a given month. The pale blue line tracks new players each month (players who had not been active in any previous months).
Data is only tracked from June 2005, the launch of the ExpressionEngine blog. Generation script and output data are available at https://github.com/kevandotorg/blognomic-player-count
Analysis by Ienpw III
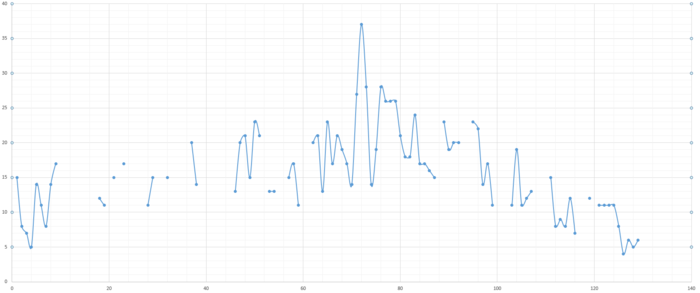
From a blog post: "Out of personal interest I made this chart containing the number of active players per dynasty, and I thought perhaps some of you might be interested." - the data is compiled from dynastic histories, which (sometimes) mention the players active at the start and/or ends of dynasties, and Ienpw "included everyone who was recorded as being active at some point during a dynasty".
Raw data used for this graph is here.
Proposals per month
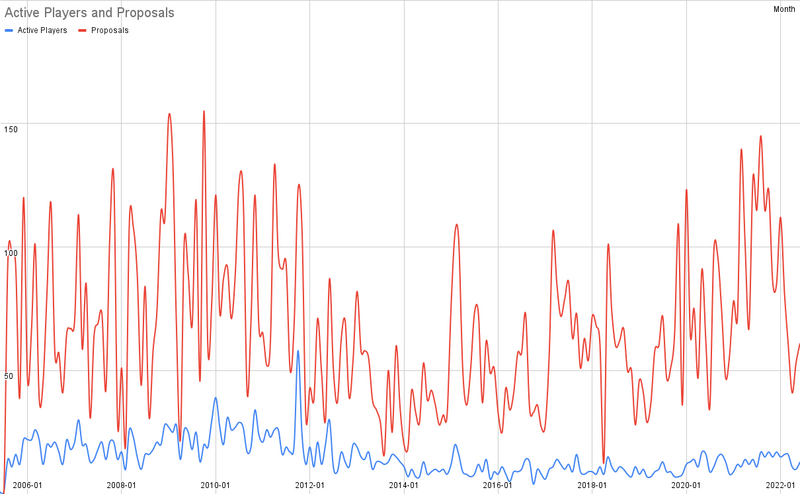
Kevan compiled some data on the number of proposals made each month (grepping for the string ">Proposal: across all monthly archives, which may be imperfect), from June 2005 to January 2024:
(The number of "active" players per month, per the earlier section, is shown in blue.)
DoV frequency
Kevan's collection of the dates of DoVs (collected here in a clunky spreadsheet that uses 3/2/1 for pass/fail/illegal, and zero for days where nothing happened), between September 2005 and November 2013.


